The United States had 14,000 on-the-job fatalities in 1970. Because of that, the Occupational Safety and Health Administration (OSHA) was created. The agency has helped reduce fatalities (there were just 5,250 on-the-job deaths in 2018) and keeps detailed statistics about accidents, fatal or otherwise, that happen when people are at work.
According to OSHA, 3.5 out of every 100,000 people die on the job each year. Those are about the same odds you have of being murdered by a firearm or of dying from cervical cancer if you're a woman. If your occupation isn’t on this list, you have a pretty good chance of surviving the workday. If you work in any of the jobs, however, you're taking a risk.
The death rates in these jobs are at least twice as high (and as much as 20 times higher) than the average death rate for all jobs. And that's not even counting their high rate of nonfatal workplace injuries. The jobs are proof that some jobs are just downright dangerous.
20. Bus and Truck Mechanics and Diesel Engine Specialists
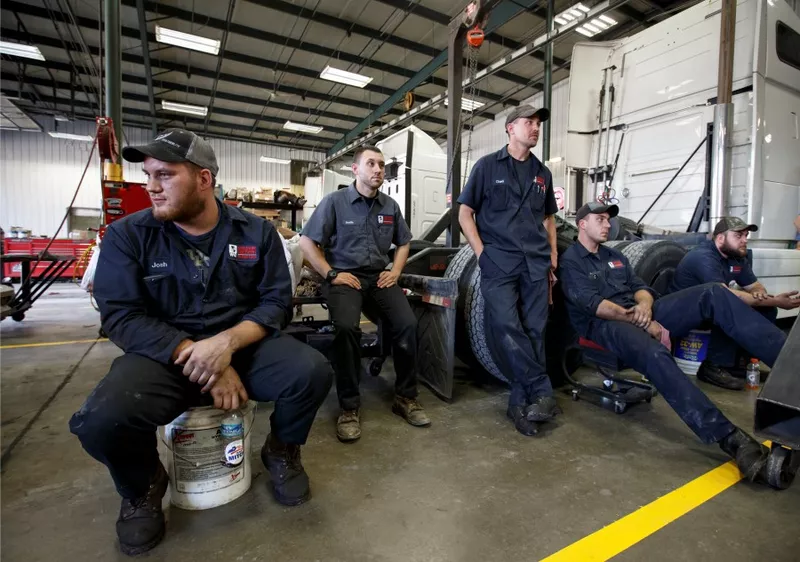
Truck mechanics in Somerset, Kentucky. J. Scott Applewhite / AP Photo
Fatal injuries per 100,000 FTE workers: 9.5
Number of jobs: 260,380
Total fatal injuries: 39
Most common fatal accidents: Bus or truck falls off a lift, rack or jack
Total nonfatal injuries: 3,610
Median annual salary: $46,360
*All data is from the U.S. Bureau of Labor Statistics. Rankings are based on the number of deaths in 2018 per 100,000 full-time equivalent (FTE) workers, or fatal injury rate.
Bottom Line: Bus and Truck Mechanics and Diesel Engine Specialists
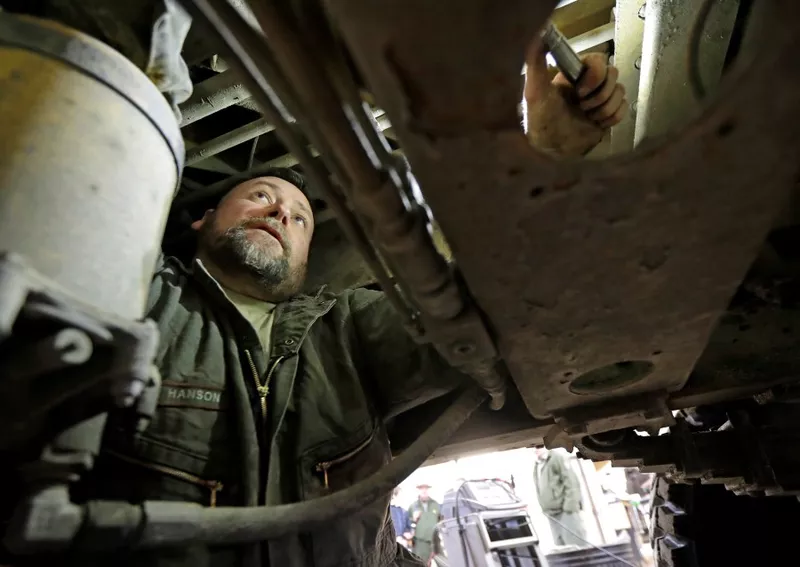
A mechanic at Mount Rainier National Park works on replacing an electric motor on a truck used to spread sand on roads in Washington state. Ted S. Warren / AP Photo
These engine specialists diagnose, adjust and repair buses and trucks that weigh between 10,000 to 40,000 pounds.
The leading cause of workplace death for this profession is when one of the heavy pieces of machinery falls on someone.
These workers also have to use power tools and do welding and had a somewhat high rate of injury as well, with 3,610 injuries reported on the job in 2018.
19. Operating Engineers and Other Construction Equipment Operators
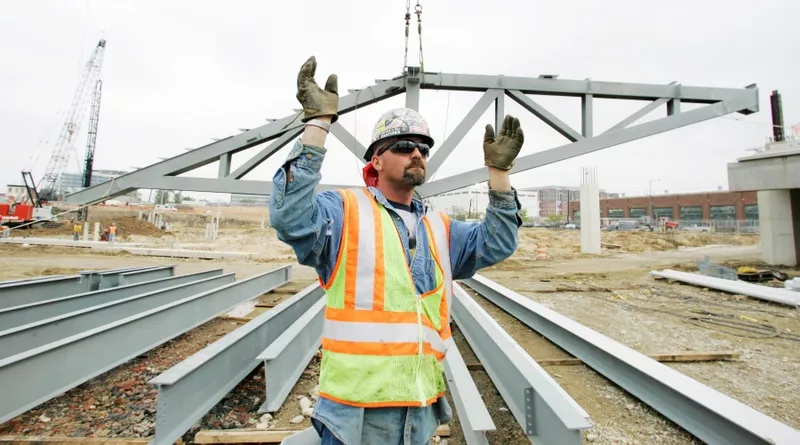
A crane operator helps move a steel truss, background, during construction of the Washington Nationals stadium in Washington, D.C., in 2006. Manuel Balce Ceneta / AP Photo
Fatal injuries per 100,000 FTE workers: 10.6
Number of jobs: 383,480
Total fatal injuries: 39
Most common fatal accidents: Contact with equipment and heavy machinery
Total nonfatal injuries: 2,280
Median annual salary: $47,810
Bottom Line: Operating Engineers and Other Construction Equipment Operators
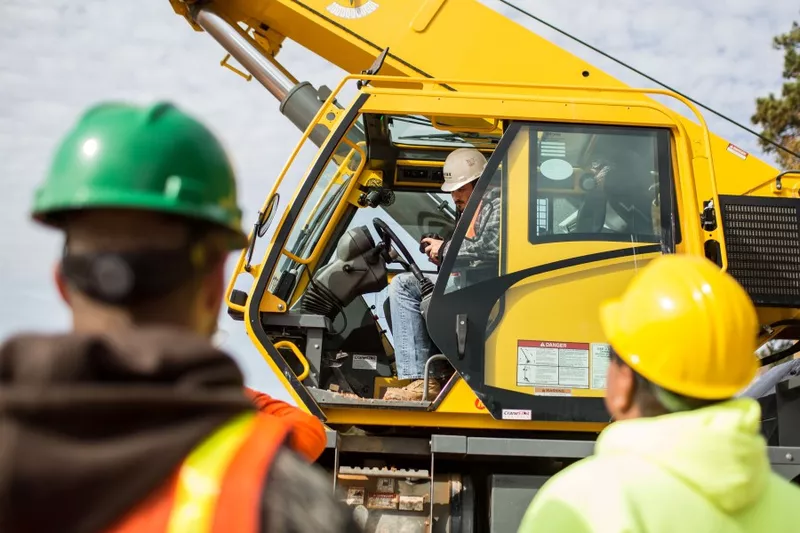
A worker starts up a crane in Conyers, Georgia. Branden Camp / AP Photo
There's a reason warning signs say do not operate heavy machinery unless you have read and understood the user manual and been well trained.
The primary cause of death in this profession is flying objects and contact with heavy machinery. These engineers and equipment operators use power equipment like bulldozers, pumps, derricks and the like, often to excavate, grade earth and pour concrete.
It's a rough job, and sometimes deadly.
18. Mining Machine Operators
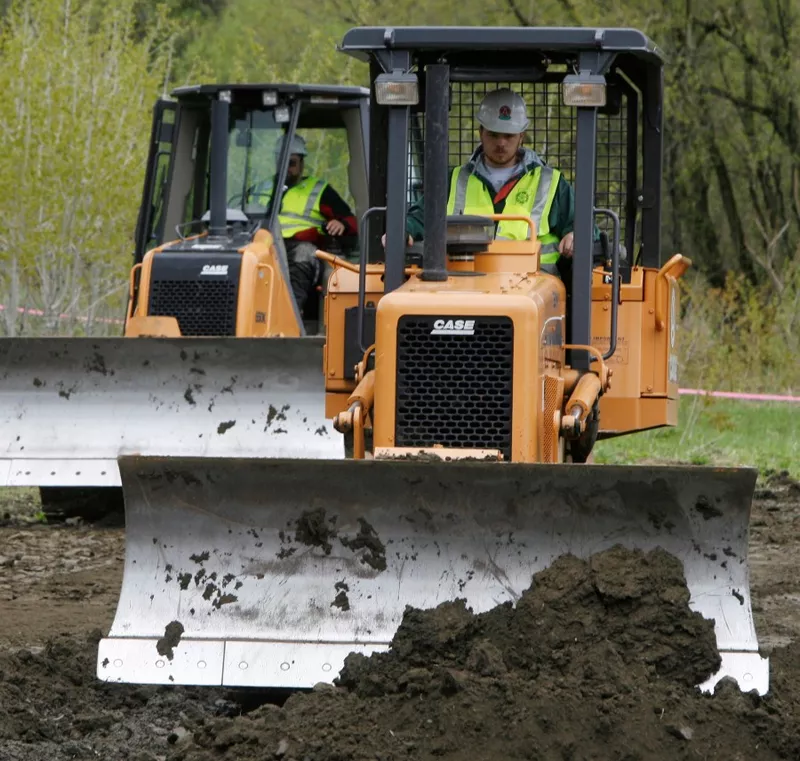
A man learns how to operate a bulldozer during a training course in Montpelier, Vermont. Toby Talbot / AP Photo
Fatal injuries per 100,000 FTE workers: 11
Number of jobs: 3,280
Total fatal injuries: 9
Most common fatal accidents: Contact with heavy objects and equipment
Total nonfatal injuries: 370
Median annual salary: $51,490
Bottom Line: Mining Machine Operators
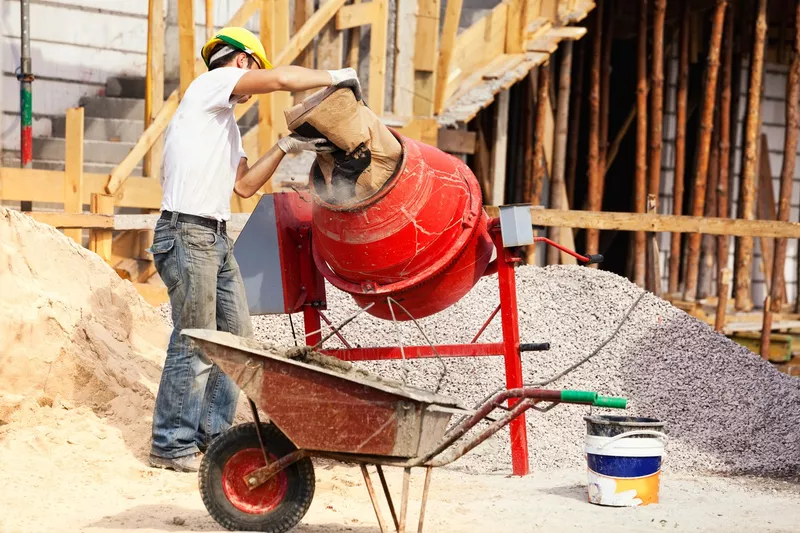
A worker mixes cement. Avalon_Studio / Getty Images
Mining machine operators operate power tools like air hammers and earth tampers and use heavy machinery like cement mixers and cranes.
Their entire profession revolves around using machines, so it's no surprise that machines are the leading cause of death in this profession.
17. Construction Laborers
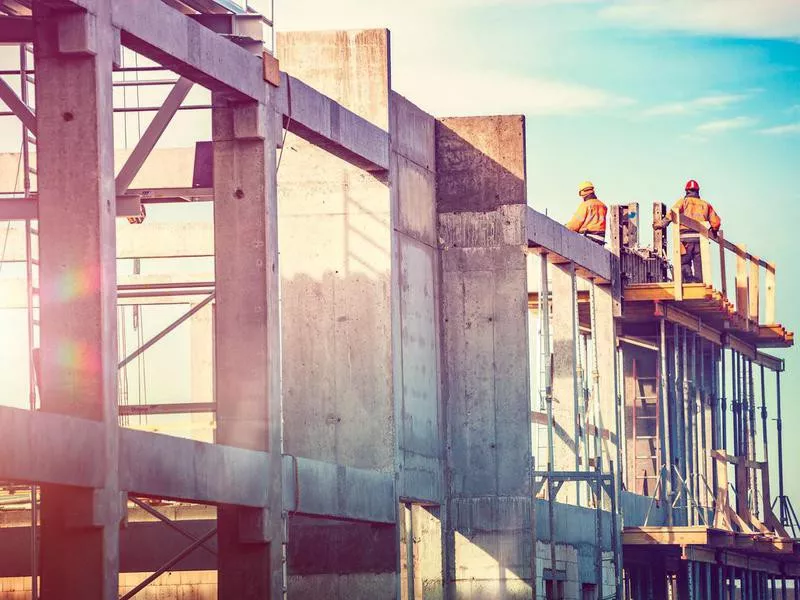
Construction workers on the job. Avalon_Studio / Getty Images
Fatal injuries per 100,000 FTE workers: 13
Number of jobs: 1,001,470
Total fatal injuries: 259
Most common fatal accidents: Falls, slips, trips
Total nonfatal injuries: 20,430
Median annual salary: $35,800
Bottom Line: Construction Laborers
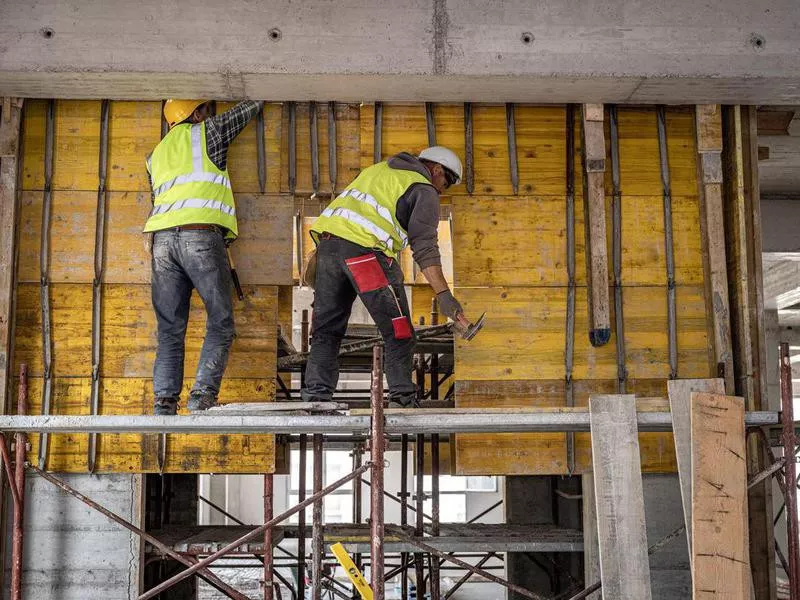
Construction is tough work. vm / Getty Images
Working construction usually means working long hours on hot, sunny days.
Aside from the heavy machinery and falling objects, most laborers die after falls.
They typically make less than $36,000 a year, too.
16. Law Enforcement Officers

Police officers in Miami Beach. Getty Images
Fatal injuries per 100,000 FTE workers: 13.7
Number of jobs: 661,330
Total fatal injuries: 108
Most common fatal accidents: Violence/other people
Total nonfatal injuries: 810
Median annual salary: $65,170
Bottom Line: Law Enforcement Officers

Police keep watch in Dallas in 2016. Ron Jenkins / AP Photo
Law enforcement officer is not the most dangerous job on this list, but it's the only job on this list where "intentional injury caused by another person" is the most frequent cause of injuries.
Roughly half of police officer deaths occur while fighting crime or responding to incidents, while the other half of officer deaths are accidental, like being hit by a car while trying to serve a ticket.
15. First-Line Supervisors of Mechanics, Installers and Repairers
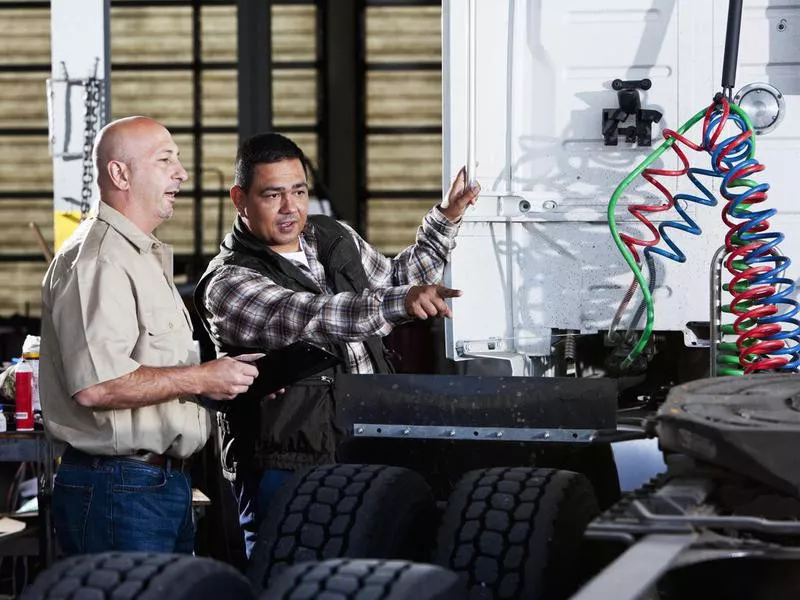
A first-line supervisor talks with one of his mechanics. kali9 / Getty Images
Fatal injuries per 100,000 FTE workers: 15.1
Number of jobs: 460,370
Total fatal injuries: 46
Most common fatal accidents: Falls, slips, trips
Total nonfatal injuries: 3,100
Median annual salary: $64,780
Bottom Line: First-Line Supervisors of Mechanics, Installers and Repairers
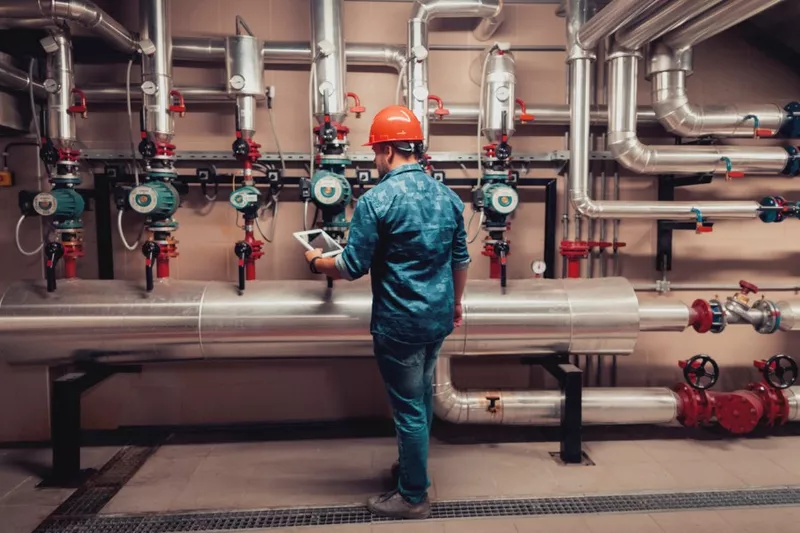
A supervisor checks some equipment during his shift. nimis69 / Getty Images
Being a supervisor may pay more than the average repair person or mechanic, but it's not a cush job.
These men and women have to work around heavy machinery and often do their job on scaffolding or other raised platforms, which can be dangerous.
14. Construction Trade Helpers
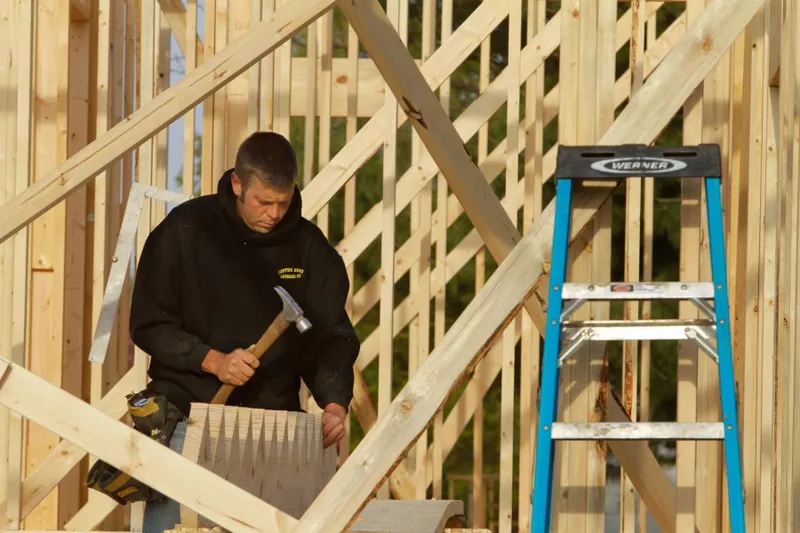
A construction worker builds a new home in Springfield, Illinois. Seth Perlman / AP Photo
Fatal injuries per 100,000 FTE workers: 15.8
Number of jobs: 23,140
Total fatal injuries: 11
Most common fatal accidents: Falls, slips, trips
Total nonfatal injuries: 1,150
Median annual salary: $29,660
Bottom Line: Construction Trade Helpers
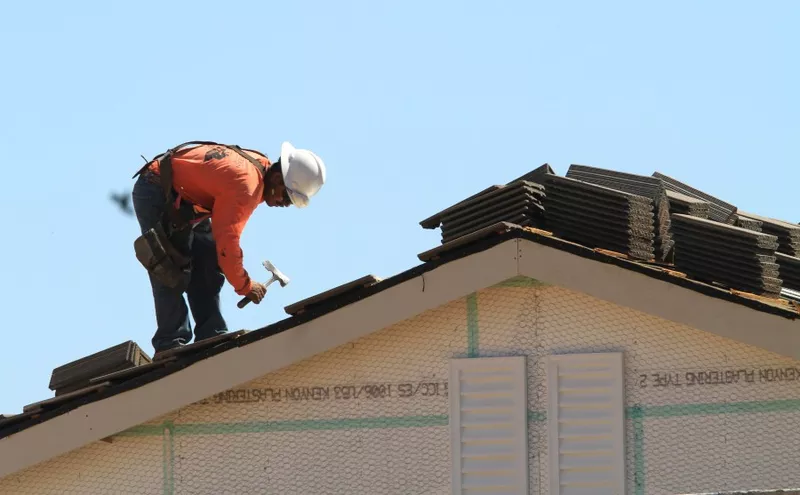
A worker on the roof of a new home under construction in Elk Grove, California. Rich Pedroncelli / AP Photo
These workers labor on construction sites, mainly by helping other workers.
Their jobs are tough and dangerous, as they require performing manual labor from great heights.
13. General Maintenance and Repair Workers
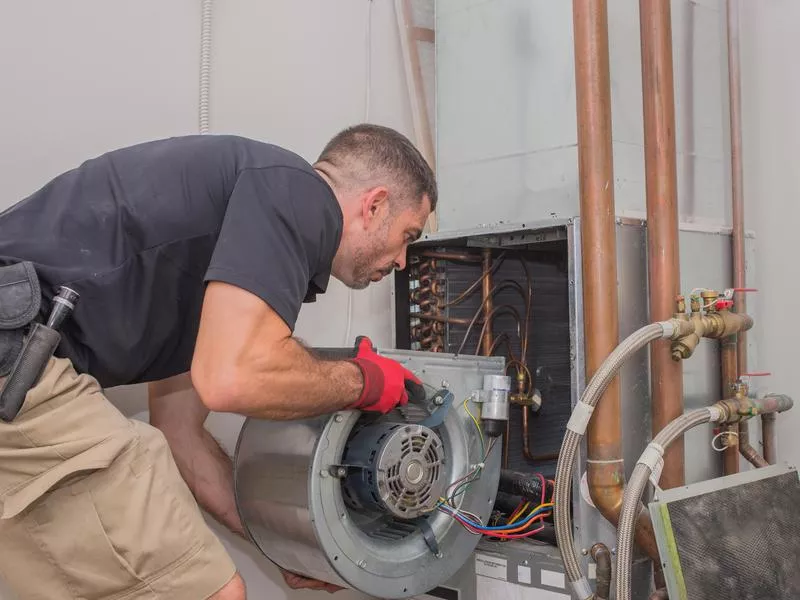
Repair workers had a fatal injury rate of 13.4 deaths per 100,000 people in 2016. Getty Images
Fatal injuries per 100,000 FTE workers: 12.5
Number of jobs: 1,351,210
Total fatal injuries: 129
Most common fatal accidents: Contact with objects and equipment
Total nonfatal injuries: 21,130
Median annual salary: $39,080
Bottom Line: General Maintenance and Repair Workers

A repair worker doing his job. wsfurlan / Getty Images
A typical day can include anything and everything, from repairing machinery to fixing flooring.
They are at greater risk to suffer electrical shocks, and much of their workday is spent in uncomfortable and cramped positions.
Repair workers had a fatal injury rate of 12.5 per 100,000 workers in 2018, plus 54,000 reported nonfatal injuries.
12. Miscellaneous Agricultural Workers

An agricultural worker hoeing the land. okugawa / Getty Images
Fatal injuries per 100,000 FTE workers: 18
Number of jobs: 5,040
Total fatal injuries: 157
Most common fatal accidents: Transportation incidents
Total nonfatal injuries: 13,160
Median annual salary: $31,160
Bottom Line: Miscellaneous Agricultural Workers
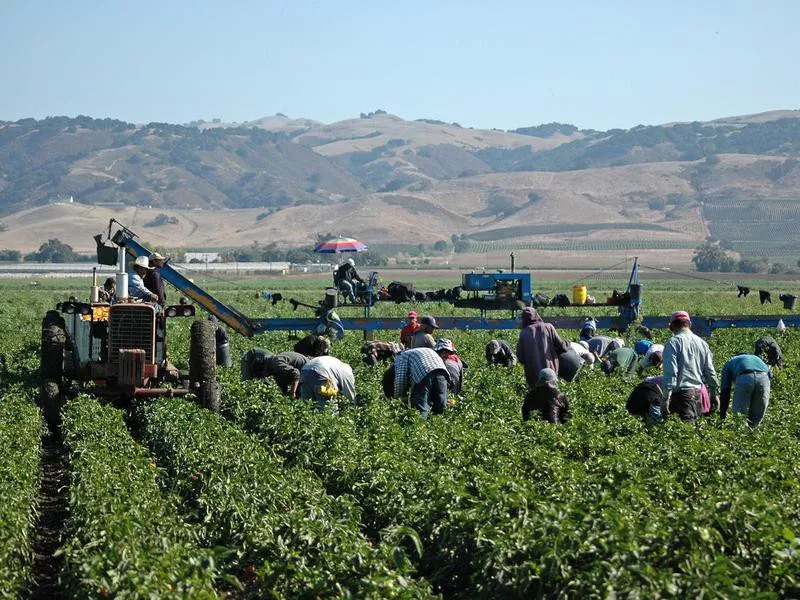
Farmworkers in California. NNehring / Getty Images
These workers maintain crops and tend to livestock, performing their duties whether there's rain or shine.
Most deaths occur due to transportation incidents. There's a lot of dangerous machinery needed to work a farm.
11. Electrical Power Line Workers
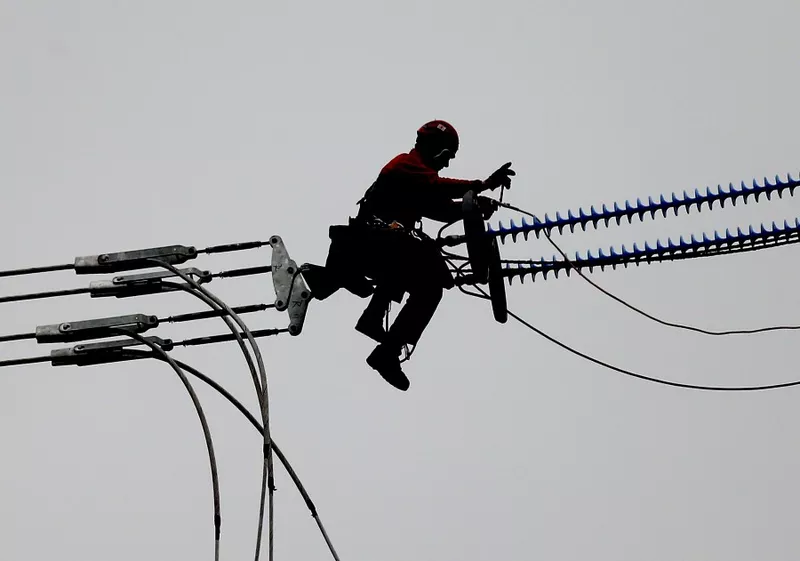
A worker straddles electric power lines in Dortmund, Germany. Frank Augstein / AP Photo
Fatal injuries per 100,000 FTE workers: 19.3
Number of jobs: 111,660
Total fatal injuries: 35
Most common fatal accidents: Exposure to harmful substances or environments
Total nonfatal injuries: 1,490
Median annual salary: $72,520
Bottom Line: Power Line Workers
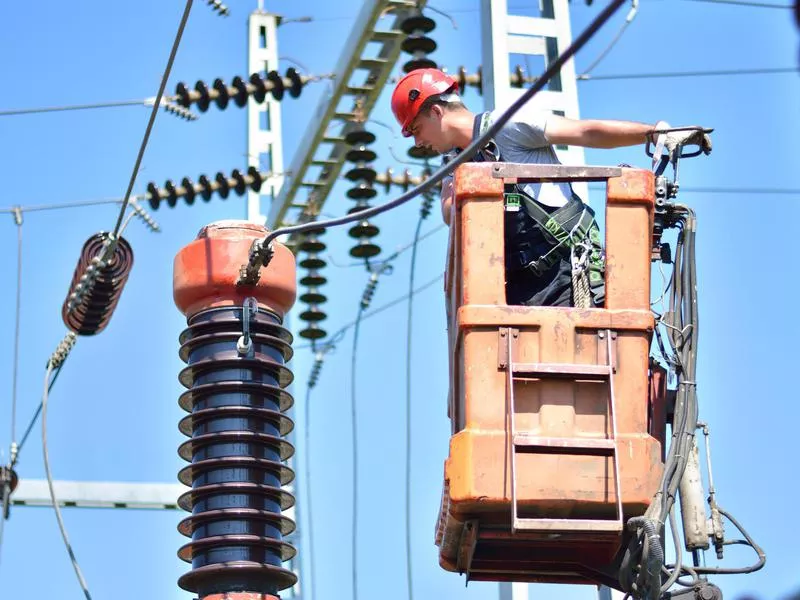
The men and women who work with high voltage lines suffered 15 work-related deaths for every 100,000 workers in 2016. Getty Images
Not surprisingly, the men and women who work with high voltage lines at great heights are prone to injury.
In addition to the 19.3 work-related deaths for every 100,000 workers in 2018, these workers suffered 1,490 nonfatal injuries, which was down from 4,670 nonfatal injuries in 2016.
The most common cause of death in this profession is electrocution.
10. Grounds Maintenance Workers

Landscapers and other grounds maintenance workers suffered 217 fatal injuries in 2016, for a rate of 17.4 per 100,000. Getty Images
Fatal injuries per 100,000 FTE workers: 20.2
Number of jobs: 100,320
Total fatal injuries: 142
Most common fatal accidents: Transportation incidents
Total nonfatal injuries: 13,030
Median annual salary: $47,030
Bottom Line: Grounds Maintenance Workers
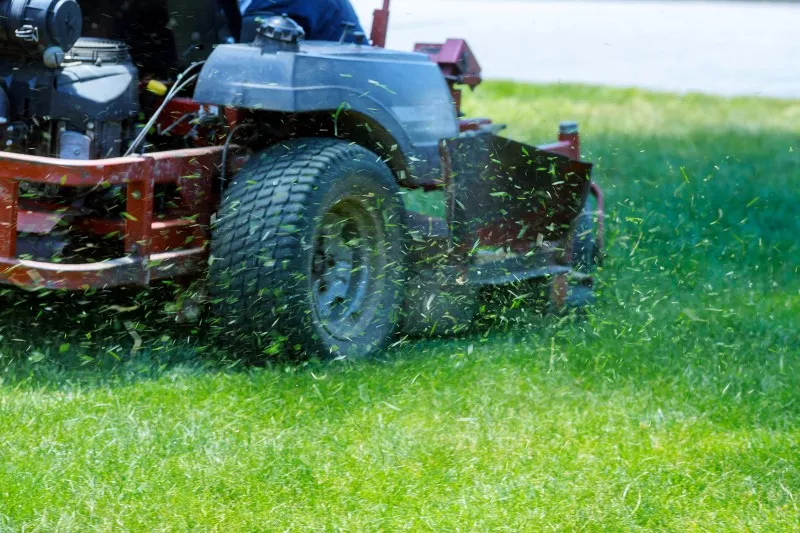
A man mows a lawn. photovs / Getty Images
Landscaping is generally a low-paying position, and quite a hazardous one. A common injury risk is being hit with a flying object, while most deaths occur due to transportation incidents.
On the positive side, there were significantly less fatalities in 2018 than in 2016, where 217 landscapers died on the job.
Slips, falls, contact with machinery and muscle soreness were among the other most frequently cited injuries.
9. Construction Supervisors
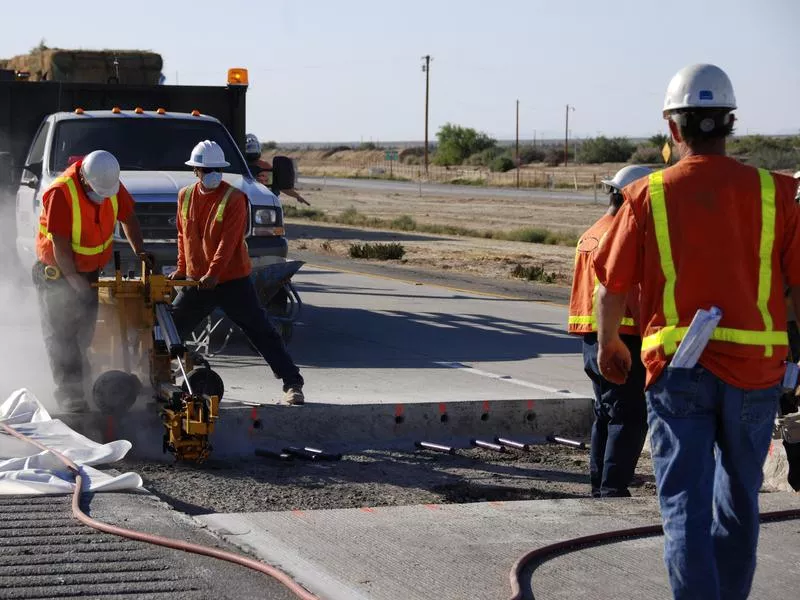
In 2016, construction supervisors suffered a death rate of 18 per 100,000 people. Getty Images
Fatal injuries per 100,000 FTE workers: 21
Number of jobs: 598,210
Total fatal injuries: 144
Most common fatal accidents: Transportation incidents
Total nonfatal injuries: 5,390
Median annual salary: $65,230
Bottom Line: Construction Supervisors
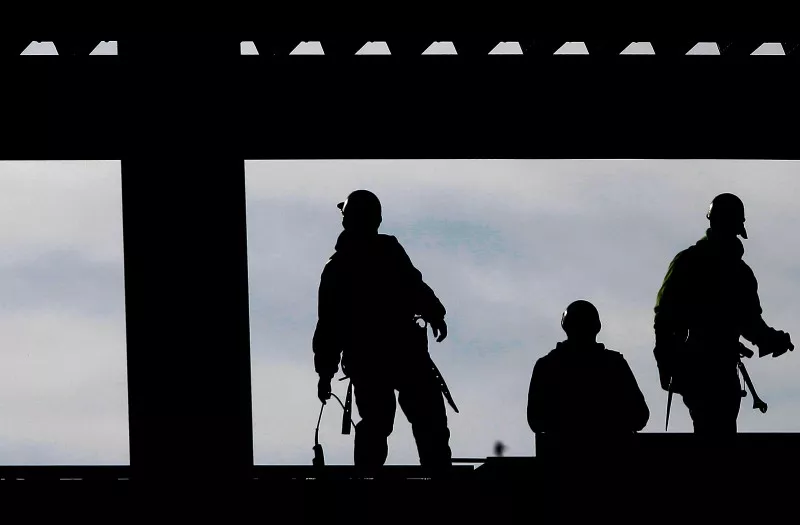
Construction workers constructing a new building in Cleveland, Ohio. Amy Sancetta / AP Photo
Being the person in charge doesn’t make this job any safer. In fact, it makes it more dangerous, with a death rate of 21 per 100,000 people. Construction laborers, by comparison, had a death rate of 15.1 per 100,000.
These workers often do road work, meaning many of the fatal and non-fatal injuries involve a worker getting hit by a passing car.
There were also 5,390 nonfatal injuries in this field in 2018.
8. Structural Steel and Ironworkers
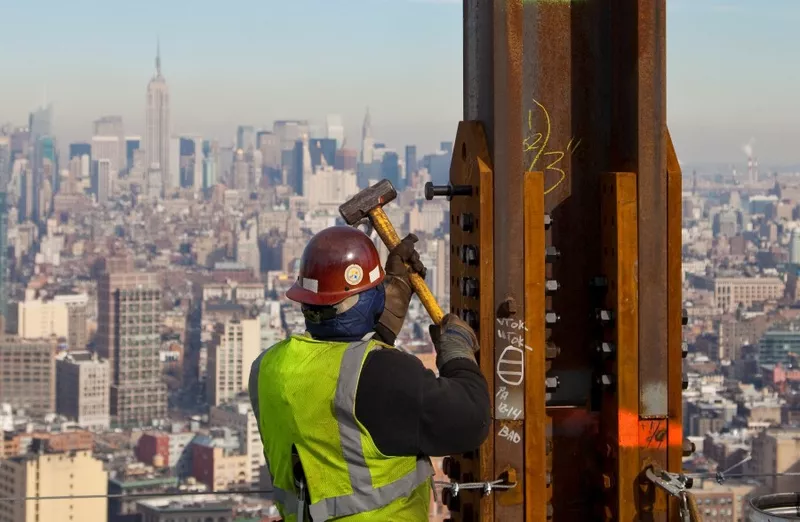
An ironworker connects a steel plate to a column at One World Trade Center in New York. Mark Lennihan / AP Photo
Fatal injuries per 100,000 FTE workers: 23.6
Number of jobs: 98,600
Total fatal injuries: 15
Most common fatal accidents: Slips and falls
Total nonfatal injuries: 800
Median annual salary: $53,650
Bottom Line: Structural Steel and Iron Workers
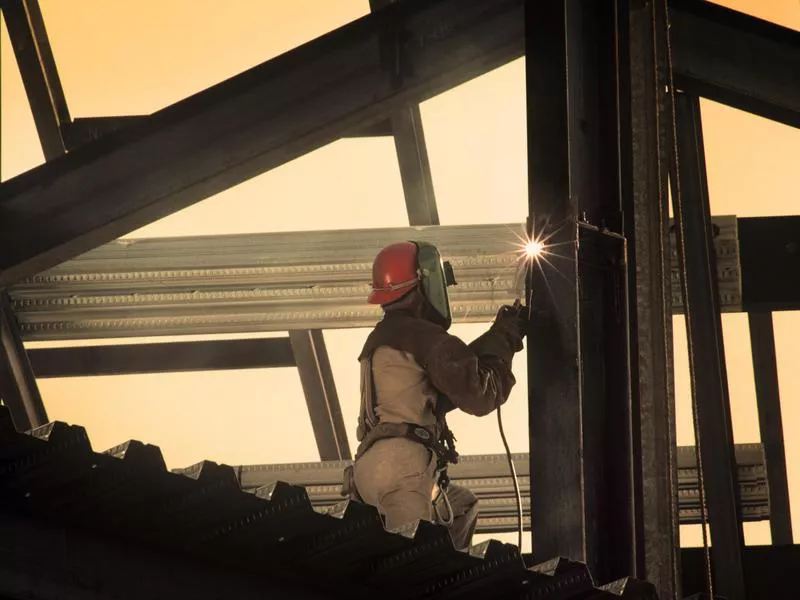
Of the 16 fatal injuries to structural steel and iron workers recorded in 2016, 56.3 percent were fall related. Getty Images
The men and women who work to fasten steel to buildings that are under construction can often be just a slip away from a fatal workplace injury.
Most injuries and deaths on this job occur due to slips and falls, which isn't surprising. These workers have to work at great heights while performing hard manual labor. For every 100,000 FTE workers, 23.6 die on the job.
On the bright side, nonfatal injuries are significantly down. In 2016, there were 1,400 injuries compared to 800 in 2018.
7. Driver/Sales Workers and Truck Drivers

Traffic accidents are an occupational hazard or truck drivers. Apriori1 / Getty Images
Fatal injuries per 100,000 FTE workers: 26
Number of jobs: 414,860
Total fatal injuries: 966
Most common fatal accidents: Transportation incident
Total non-fatal injuries: 78,520
Median annual salary: $32,020
Bottom Line: Driver/Sales Workers and Truck Drivers
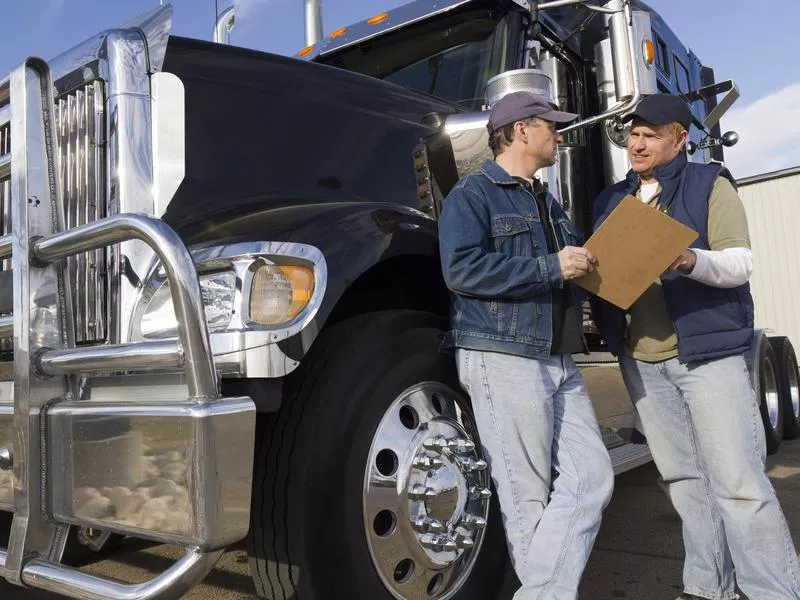
Truckers and drivers suffered 918 fatal injuries in 2016 for a rate of 24.7 deaths per 100,000. Getty Images
Truckers and drivers suffered 966 fatal injuries in 2018.
There were also an astounding 78,520 nonfatal injuries. The most common cause of injuries was not, surprisingly, transportation accidents, but overexertion, like back injuries.
Motor vehicle accidents did, however, account for the majority of fatal accidents. Fatal work injury rates among truckers and drivers was 26 deaths per 100,000 FTE workers.
6. Farmers and Ranchers
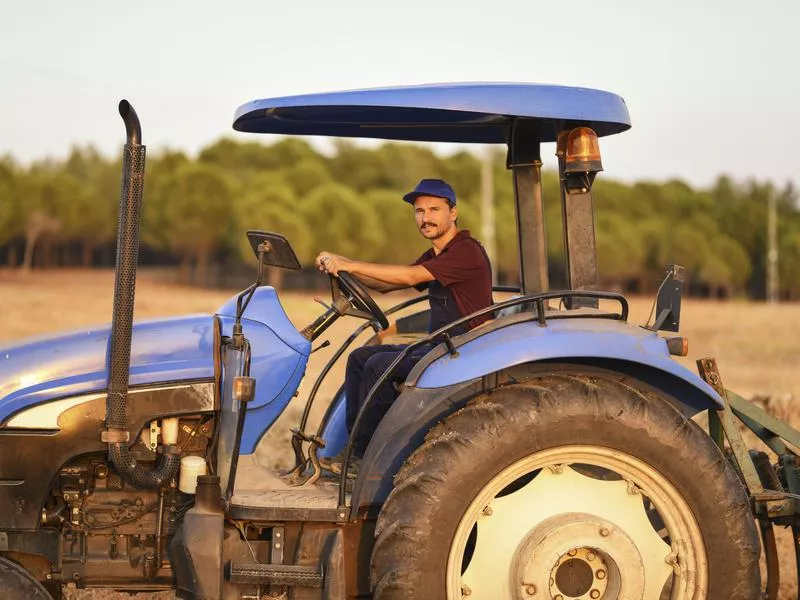
Farmers and ranchers suffered 260 deaths in 2016, or 23.1 per 100,000. Getty Images
Fatal injuries per 100,000 FTE workers: 24.7
Number of jobs: 876,300
Total fatal injuries: 257
Most common fatal accidents: Transportation incidents
Total nonfatal injuries: 280
Median annual salary: $71,160
Bottom Line: Farmers and Ranchers
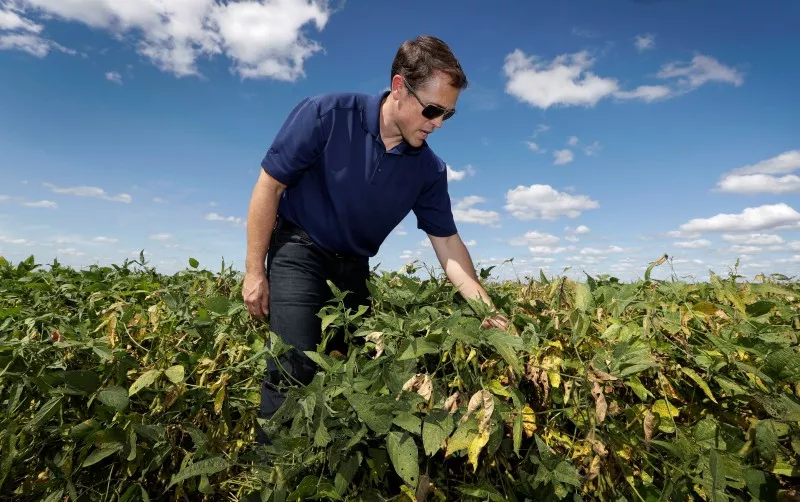
A farmer checks soybean plants on his farm near Maxwell, Iowa. Charlie Neibergall / AP Photo
Transportation incidents made up the majority of fatal injuries for farmers.
Transportation incident means an accident with any vehicle designed for moving goods, like forklifts and wheelbarrows. There's a lot of that kind of equipment on a farm.
Farmers and ranchers do fare better when it comes to nonfatal injuries than some other dangerous jobs. Common workplace injuries in this field are slips and falls and musculoskeletal injuries.
5. Trash Collectors
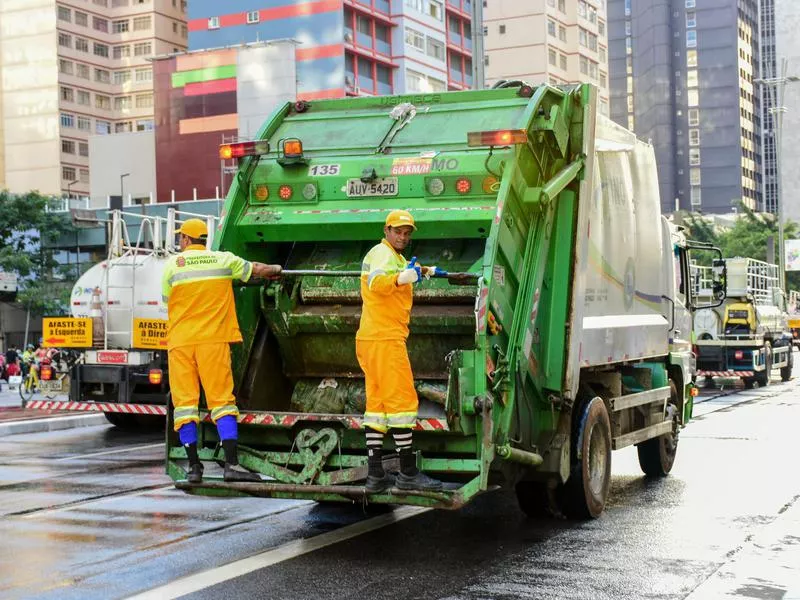
Two-thirds of the 31 deaths in this field of work were transportation related. Getty Images
Fatal injuries per 100,000 FTE workers: 44.3
Number of jobs: 121,330
Total fatal injuries: 61
Most common fatal accidents: Transportation incidents
Total nonfatal injuries: 1,490
Median annual salary: $41,400
Bottom Line: Trash Collectors
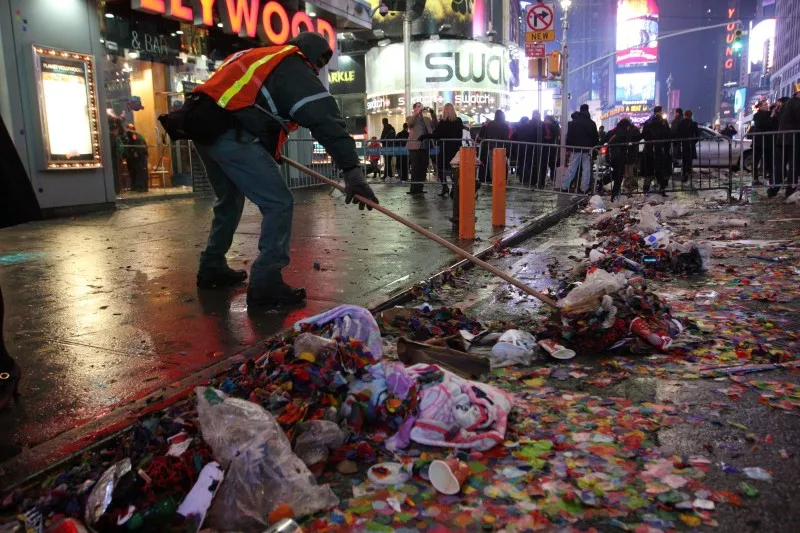
A sanitation worker cleans up garbage in New York's Times Square. Tina Fineberg / AP Photo
Since trash collectors spend the majority of their workday hopping on and off the back of a moving truck, the majority of deaths in this field are transportation related. Being hit by a car is a very real danger.
Trash collectors also get hurt from trips and falls, sprains, strains and tears.
4. Roofers
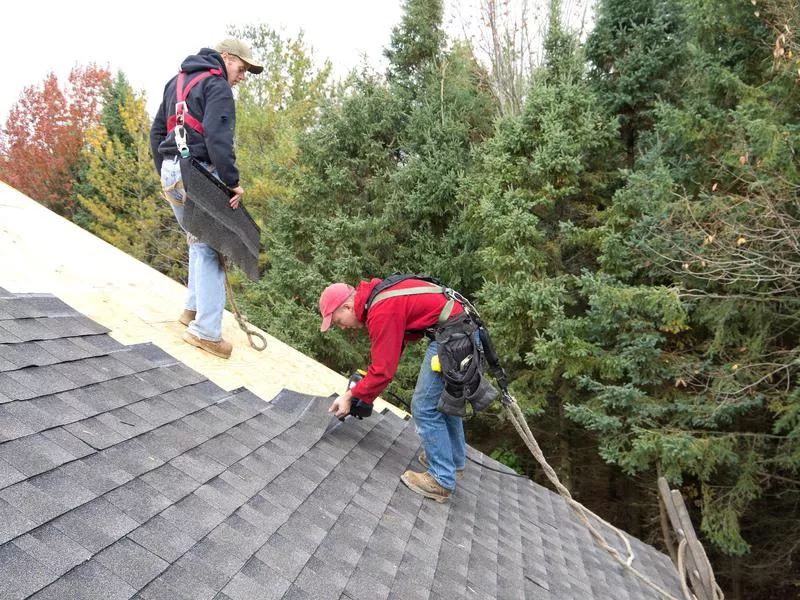
Roofers suffer a lot of slips and falls. Getty Images
Fatal injuries per 100,000 FTE workers: 51.5
Number of jobs: 160,600
Total fatal injuries: 106
Most common fatal accidents: Slips and falls
Total nonfatal injuries: 2,060
Median annual salary: $42,100
Bottom Line: Roofers
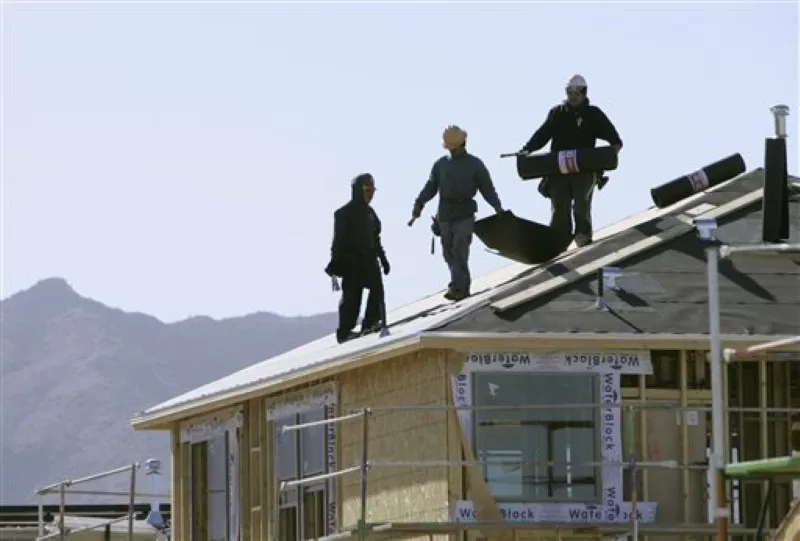
Roofers are exposed to hot weather. Ross D. Franklin / AP Photo
As of 2018, 106 roofers died on the job, and another 2,060 were injured. Not surprisingly, the most common causes of injuries were slips and falls, but roofers also are exposed to hot weather, and their jobs involve lots of bending and heavy lifting.
And when roofers get hurt, their injuries are serious. They have an average recovery time of 20 days off the job after an accident, which is significantly longer than most other professions, according to the BLS.
Also according to the BLS, roofing jobs are growing, with a 10-year job outlook rate of 12 percent, much faster than average, with an expected 19,000 jobs added to the industry by 2028.
3. Pilots and Flight Engineers

The death rate for aviation professionals is 55.5 per 100,000 people. Getty Images
Fatal injuries per 100,000 FTE workers: 58.9
Number of jobs: 82,890
Total fatal injuries: 70
Most common fatal accidents: Transportation incidents
Total nonfatal injuries: 490
Median annual salary: $165,560
Bottom Line: Pilots and Flight Engineers

Pilots at work. Getty Images
Overnight layovers and constantly shifting work schedules make pilots prone to exhaustion.
The leading cause of injuries among this profession is general soreness and pain. The most common cause of fatalities in this profession is plane crashes, as you might imagine.
The death rate for aviation professionals in 2018 was 58.9 per 100,000 FTE workers, an increase of about 2 percent since 2016.
.
2. Fishers and Fishing Workers
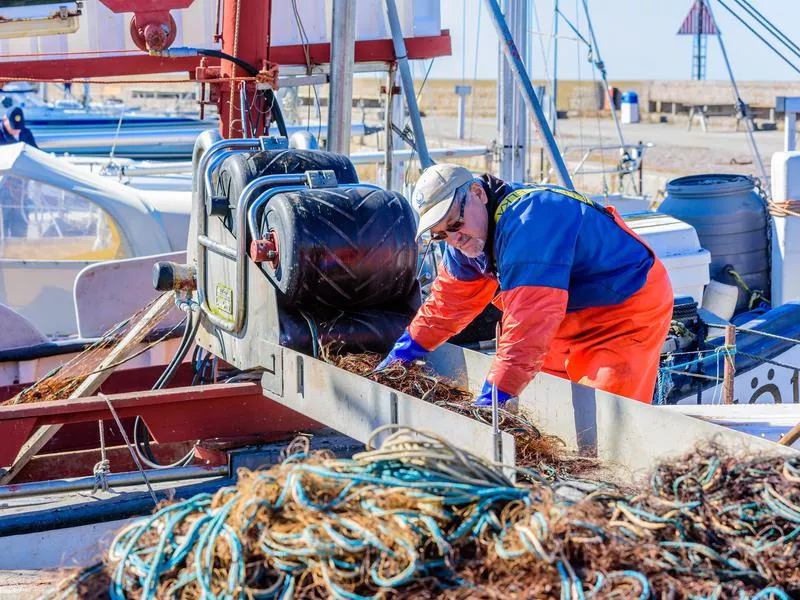
There were 24 fishing fatalities in 2016, enough for a rate of 86 per 100,000 workers. Getty Images
Fatal injuries per 100,000 FTE workers: 77.4
Number of jobs: 520
Total fatal injuries: 33
Most common fatal accidents: Transportation incidents
Total non-fatal injuries: 710
Median annual salary: $31,190
Bottom Line: Fishing
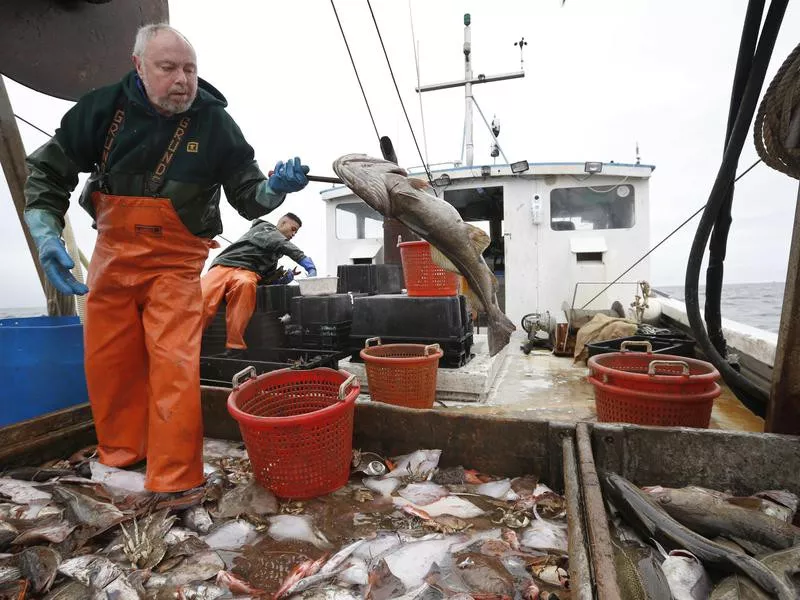
A fisherman flips a cod while sorting groundfish caught off the coast of New Hampshire. Robert F. Bukaty / AP Photo
There's a lot that can go wrong when you're fishing off the coast while working with heavy machinery and navigating slippery surfaces. There were 33 fishing fatalities in 2018, enough for a rate of 77.4 per 100,000 FTE workers.
Fishers are exposed to harsh weather conditions, and because trips can last days or weeks, they don't necessarily have the choice of calling off the workday when the weather is bad.
While fishing carries a risk almost as great as logging, the salary is even worse: Fishermen made an average annual salary of $31,190.
1. Logging Workers
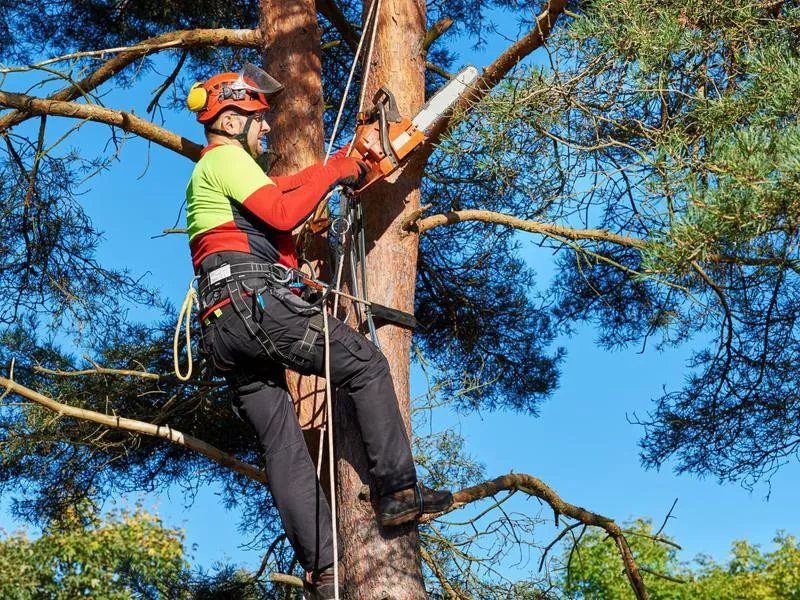
A lumberjack with a saw and harness goes to work in a tree. Getty Images
Fatal injuries per 100,000 FTE workers: 97.6
Number of jobs: 53,600
Total fatal injuries: 75
Most common fatal accidents: Contact with objects and equipment
Total non-fatal injuries: 1,040
Median annual salary: $41,230
Bottom Line: Logging Workers
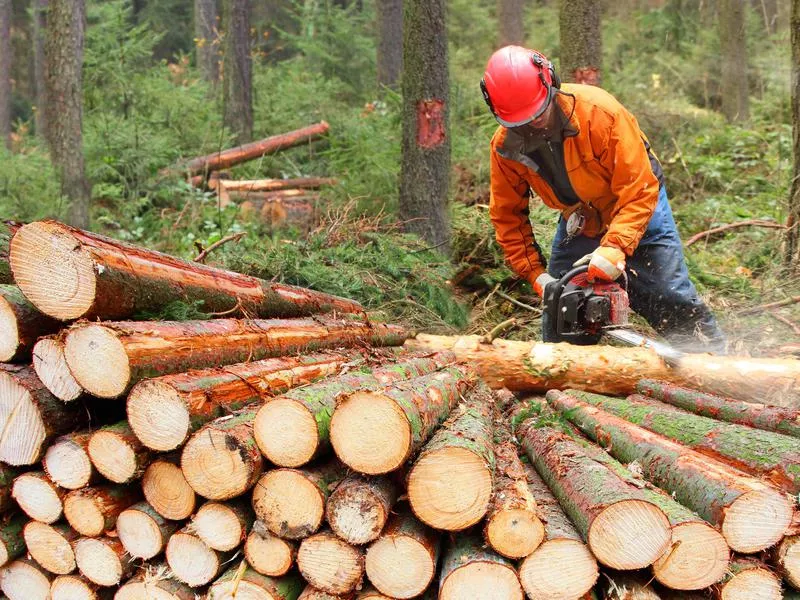
Geography played into logging's astounding death rate of 135.9 fatal accidents per 100,000 workers in 2016. Getty Images
The line from Monty Python’s "The Lumberjack Song"— "I'm a lumberjack and I'm OK" — doesn't always apply to loggers.
The most common injury, fatal or otherwise, is being hit by a falling object. Loggers often work outdoors and in remote areas, far from emergency medical care. Plus, they're working with dangerous equipment, like chainsaws and wood chippers. Forty-nine deaths occur due to contact with machinery and other objects.
In addition to the 75 fatalities OSHA recorded among loggers in 2018, there were 1,040 nonfatal injuries. To top it off, loggers are relatively low-paid when you consider the risk.
For more information about occupational hazards, visit the U.S. Bureau of Labor Statistics site.
